JVM GC tuning is the first tuning all system/application administrator perform to improve the system performance. Tuning is a gradual process. You cannot magically improve the performance of your application/system with in a day.
JVM GC tuning is a very important part of tuning exercise and need to be done whenever you observe a change in workload profile of your JVM. I am giving here an idea on CMS ( Concurrent Mark Sweep Collector ) of the HotSpot JVM.
Before going into the details, we must understand what is CMS Garbage Collector and how it works.
A CMS Garbage Collector is non-compacting low-latency collector. Below are the phases of a CMS concurrent collection.
1. Initial Mark: This is a stop-the-world phase hence all application threads are stopped. All the reachable live objects associated with stopped application threads are marked during this phase.
2. Concurrent Mark: During this concurrent phase, all application threads are restarted. Using the object references collected during "Initial Mark" phase, all other reference/live objects are identified.
3. Pre-cleaning Phase: This is an optimization phase in which changes to object references made by the application threads during the "Concurrent Mark" phase are identified. This is required as objects which were referred by say thread A during "initial mark" phase, may have been changed and are now referred by say thread B. These changes identified during this phase are then used to update the results from "Concurrent Mark" phase.
4. Remark Phase: This is a stop-the-world phase. CMS must stop all the application threads in this phase and then catch up with the changes the application has gone through. This step is essential so as to avoid collecting any objects that are still referenced.
5. Sweep Phase: During this concurrent phase, all non-referenced objects (i.e. dead objects) are removed from the heap.
6. Reset Phase: In this concurrent phase, CMS does some housekeeping work so that it is ready for the next Garbage Collection cycle.
Now we know how CMS GC works. Its time to see how to use it in real case scenario. Firstly I am going to give the initial heap setting that I had in my environment.
-d64 -server -Xms6g -Xmx6g -XX:SurvivorRatio=6 -XX:PermSize=256m -XX:MaxPermSize=1024m -Xmn3686m -XX:NewSize=3686m -XX:MaxNewSize=3686m -XX:+UseConcMarkSweepGC -XX:+CMSClassUnloadingEnable
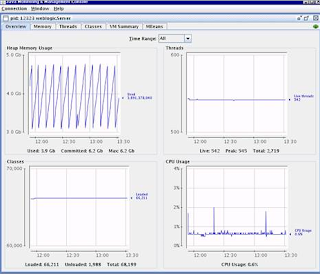
Even though I was using CMS GC, I was not using it properly. As you can see from the below screenshots that I captured using JConsole

In above screenshot, it is evident that CPU utilization was very high.

In this screenshot, the pause time is huge and the number of full GC is high too.
So to fix this what I did was, I added few new parameters and updates few existing parameters as below.
-d64 -server -Xms6g -Xmx6g -XX:SurvivorRatio=8 -XX:PermSize=256m -XX:MaxPermSize=1024m -Xmn2048m -XX:+UseParNewGC -XX:+UseConcMarkSweepGC -XX:CMSInitiatingOccupancyFraction=75 -XX:+UseCMSInitiatingOccupancyOnly -XX:+ScavengeBeforeFullGC -XX:+CMSClassUnloadingEnabled

Now lets understand these parameters.
-Xmn - This parameter defines the size of young generation. I recommend to keep this value between 30%-35% of total heap size i.e. (-Xmx. Keep -Xmx & -Xms same.)
-XX:+UseParNewGC - Enables the use of the modified parallel throughput collector in the young generation.
-XX:CMSInitiatingOccupancyFraction - Set the percentage of the heap that must be full before the JVM starts a concurrent collection in the tenured/old generation.
-XX:+UseCMSInitiatingOccupancyOnly - Enables the feature that all concurrent CMS cycles should start based on -XX:CMSInitiatingOccupancyFraction=75
-XX:+ScavengeBeforeFullGC - Enables the feature that forces a young generation collection before starting a new CMS cycle or before a full GC is attempted
I hope after making the suggested changes, you will also experience an improve in performance. Do share your experience in the comment section below.
JVM GC tuning is a very important part of tuning exercise and need to be done whenever you observe a change in workload profile of your JVM. I am giving here an idea on CMS ( Concurrent Mark Sweep Collector ) of the HotSpot JVM.
Before going into the details, we must understand what is CMS Garbage Collector and how it works.
A CMS Garbage Collector is non-compacting low-latency collector. Below are the phases of a CMS concurrent collection.
1. Initial Mark: This is a stop-the-world phase hence all application threads are stopped. All the reachable live objects associated with stopped application threads are marked during this phase.
2. Concurrent Mark: During this concurrent phase, all application threads are restarted. Using the object references collected during "Initial Mark" phase, all other reference/live objects are identified.
3. Pre-cleaning Phase: This is an optimization phase in which changes to object references made by the application threads during the "Concurrent Mark" phase are identified. This is required as objects which were referred by say thread A during "initial mark" phase, may have been changed and are now referred by say thread B. These changes identified during this phase are then used to update the results from "Concurrent Mark" phase.
4. Remark Phase: This is a stop-the-world phase. CMS must stop all the application threads in this phase and then catch up with the changes the application has gone through. This step is essential so as to avoid collecting any objects that are still referenced.
5. Sweep Phase: During this concurrent phase, all non-referenced objects (i.e. dead objects) are removed from the heap.
6. Reset Phase: In this concurrent phase, CMS does some housekeeping work so that it is ready for the next Garbage Collection cycle.
Now we know how CMS GC works. Its time to see how to use it in real case scenario. Firstly I am going to give the initial heap setting that I had in my environment.
-d64 -server -Xms6g -Xmx6g -XX:SurvivorRatio=6 -XX:PermSize=256m -XX:MaxPermSize=1024m -Xmn3686m -XX:NewSize=3686m -XX:MaxNewSize=3686m -XX:+UseConcMarkSweepGC -XX:+CMSClassUnloadingEnable
Even though I was using CMS GC, I was not using it properly. As you can see from the below screenshots that I captured using JConsole

In above screenshot, it is evident that CPU utilization was very high.

In this screenshot, the pause time is huge and the number of full GC is high too.
So to fix this what I did was, I added few new parameters and updates few existing parameters as below.
-d64 -server -Xms6g -Xmx6g -XX:SurvivorRatio=8 -XX:PermSize=256m -XX:MaxPermSize=1024m -Xmn2048m -XX:+UseParNewGC -XX:+UseConcMarkSweepGC -XX:CMSInitiatingOccupancyFraction=75 -XX:+UseCMSInitiatingOccupancyOnly -XX:+ScavengeBeforeFullGC -XX:+CMSClassUnloadingEnabled


Now lets understand these parameters.
-Xmn - This parameter defines the size of young generation. I recommend to keep this value between 30%-35% of total heap size i.e. (-Xmx. Keep -Xmx & -Xms same.)
-XX:+UseParNewGC - Enables the use of the modified parallel throughput collector in the young generation.
-XX:CMSInitiatingOccupancyFraction - Set the percentage of the heap that must be full before the JVM starts a concurrent collection in the tenured/old generation.
-XX:+UseCMSInitiatingOccupancyOnly - Enables the feature that all concurrent CMS cycles should start based on -XX:CMSInitiatingOccupancyFraction=75
-XX:+ScavengeBeforeFullGC - Enables the feature that forces a young generation collection before starting a new CMS cycle or before a full GC is attempted
I hope after making the suggested changes, you will also experience an improve in performance. Do share your experience in the comment section below.